

Reports and dashboard
Dashboard
Section titled “Dashboard”Panoramica (Overview) is the marina’s dashboard: each tile shows the value of the period, the comparison with the same period last year and the trend.
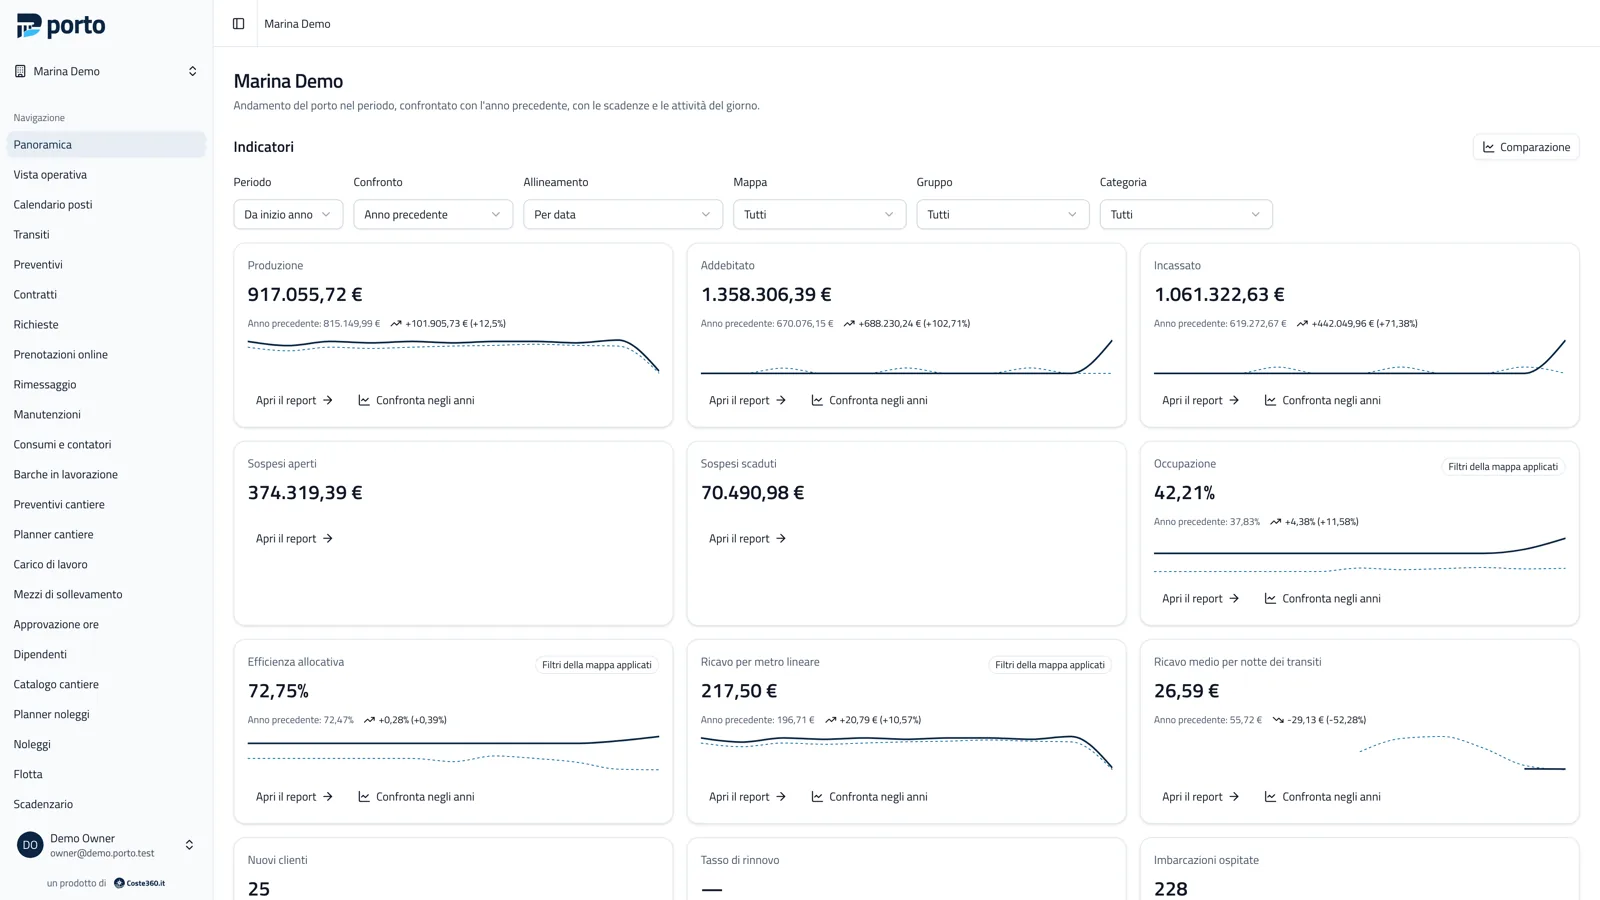
Tiles: revenue, charged and collected, receivables, occupancy and allocation efficiency, revenue per metre of berth and per transit night, customers and renewals, boats hosted, boatyard and rentals. Each tile opens the report it is made of, with the same filters, and its value equals the sum of those records.
Reports
Section titled “Reports”| Report | What it measures |
|---|---|
| Occupancy | occupied over available berth-nights, physical and contractual |
| Efficiency and allocation waste | how much of the berth the boat really uses; lost potential revenue and swap suggestions |
| Lost demand | unmet inquiries by reason, period, length band and channel |
| Customers, vessels | customers by category, nationality, seniority, value, renewals; boats by type, length, flag |
| Revenue, accruals and deferrals | the value of contracts and transits split by service days |
| Charges, payments, revenue classes | by period, customer, item, origin, payment and invoicing state, VAT |
| Receivables | open items by age and reminders sent |
| Presence | arrivals, departures, absences of annual contracts, releases and resales |
| Berth rights, cash | holders, fees and splits; cash sessions and daily takings |
| Dry storage, maintenance, utilities | area occupancy, tasks, consumption |
| Boatyard, rentals, sensors | hours and margins; fleet utilisation and deposits; sensor discrepancies |
| Comparison | any indicator between two periods or years, aligned by date or by weekday |
Comparisons go back up to 5 years. Every report exports as CSV (Italian format: ; separator, decimal comma)
and Excel. Which reports you see depends on your role (Overview).


Porto is developed by Coste360 SRL. Source available under the BSL 1.1; the Porto trademark is not covered by the licence.